Dashboards and reports for any data, built by anyone.
Your whole team gets the visualization tools an analyst would use. No new language to learn, no SQL to write, no limit on what you can build.
Built for freedom, not just display.
Every chart type ships on every paid plan. Full control over axes, labels, grouping, and filters. Powerful enough for analysts, simple enough for your whole team.
Anyone on your team can build this.
Pick a dataset, choose your fields, and the chart builds itself. No jargon. No friction.
Every axis, grouping, and filter is yours.
Full control over how your data is sliced. Group by region, break down by product, stack by category. Change anything without starting over.
Eighteen chart types. Not the same four.
Line, bar, scatter, heatmap, Sankey, funnel, gauge, treemap, world map, and more. The right chart for the question, not just the easy one.
From upload to dashboard in minutes.
Drag in a CSV, connect a Google Sheet, or pipe in a webhook. Your first dashboard is live before your coffee gets cold.
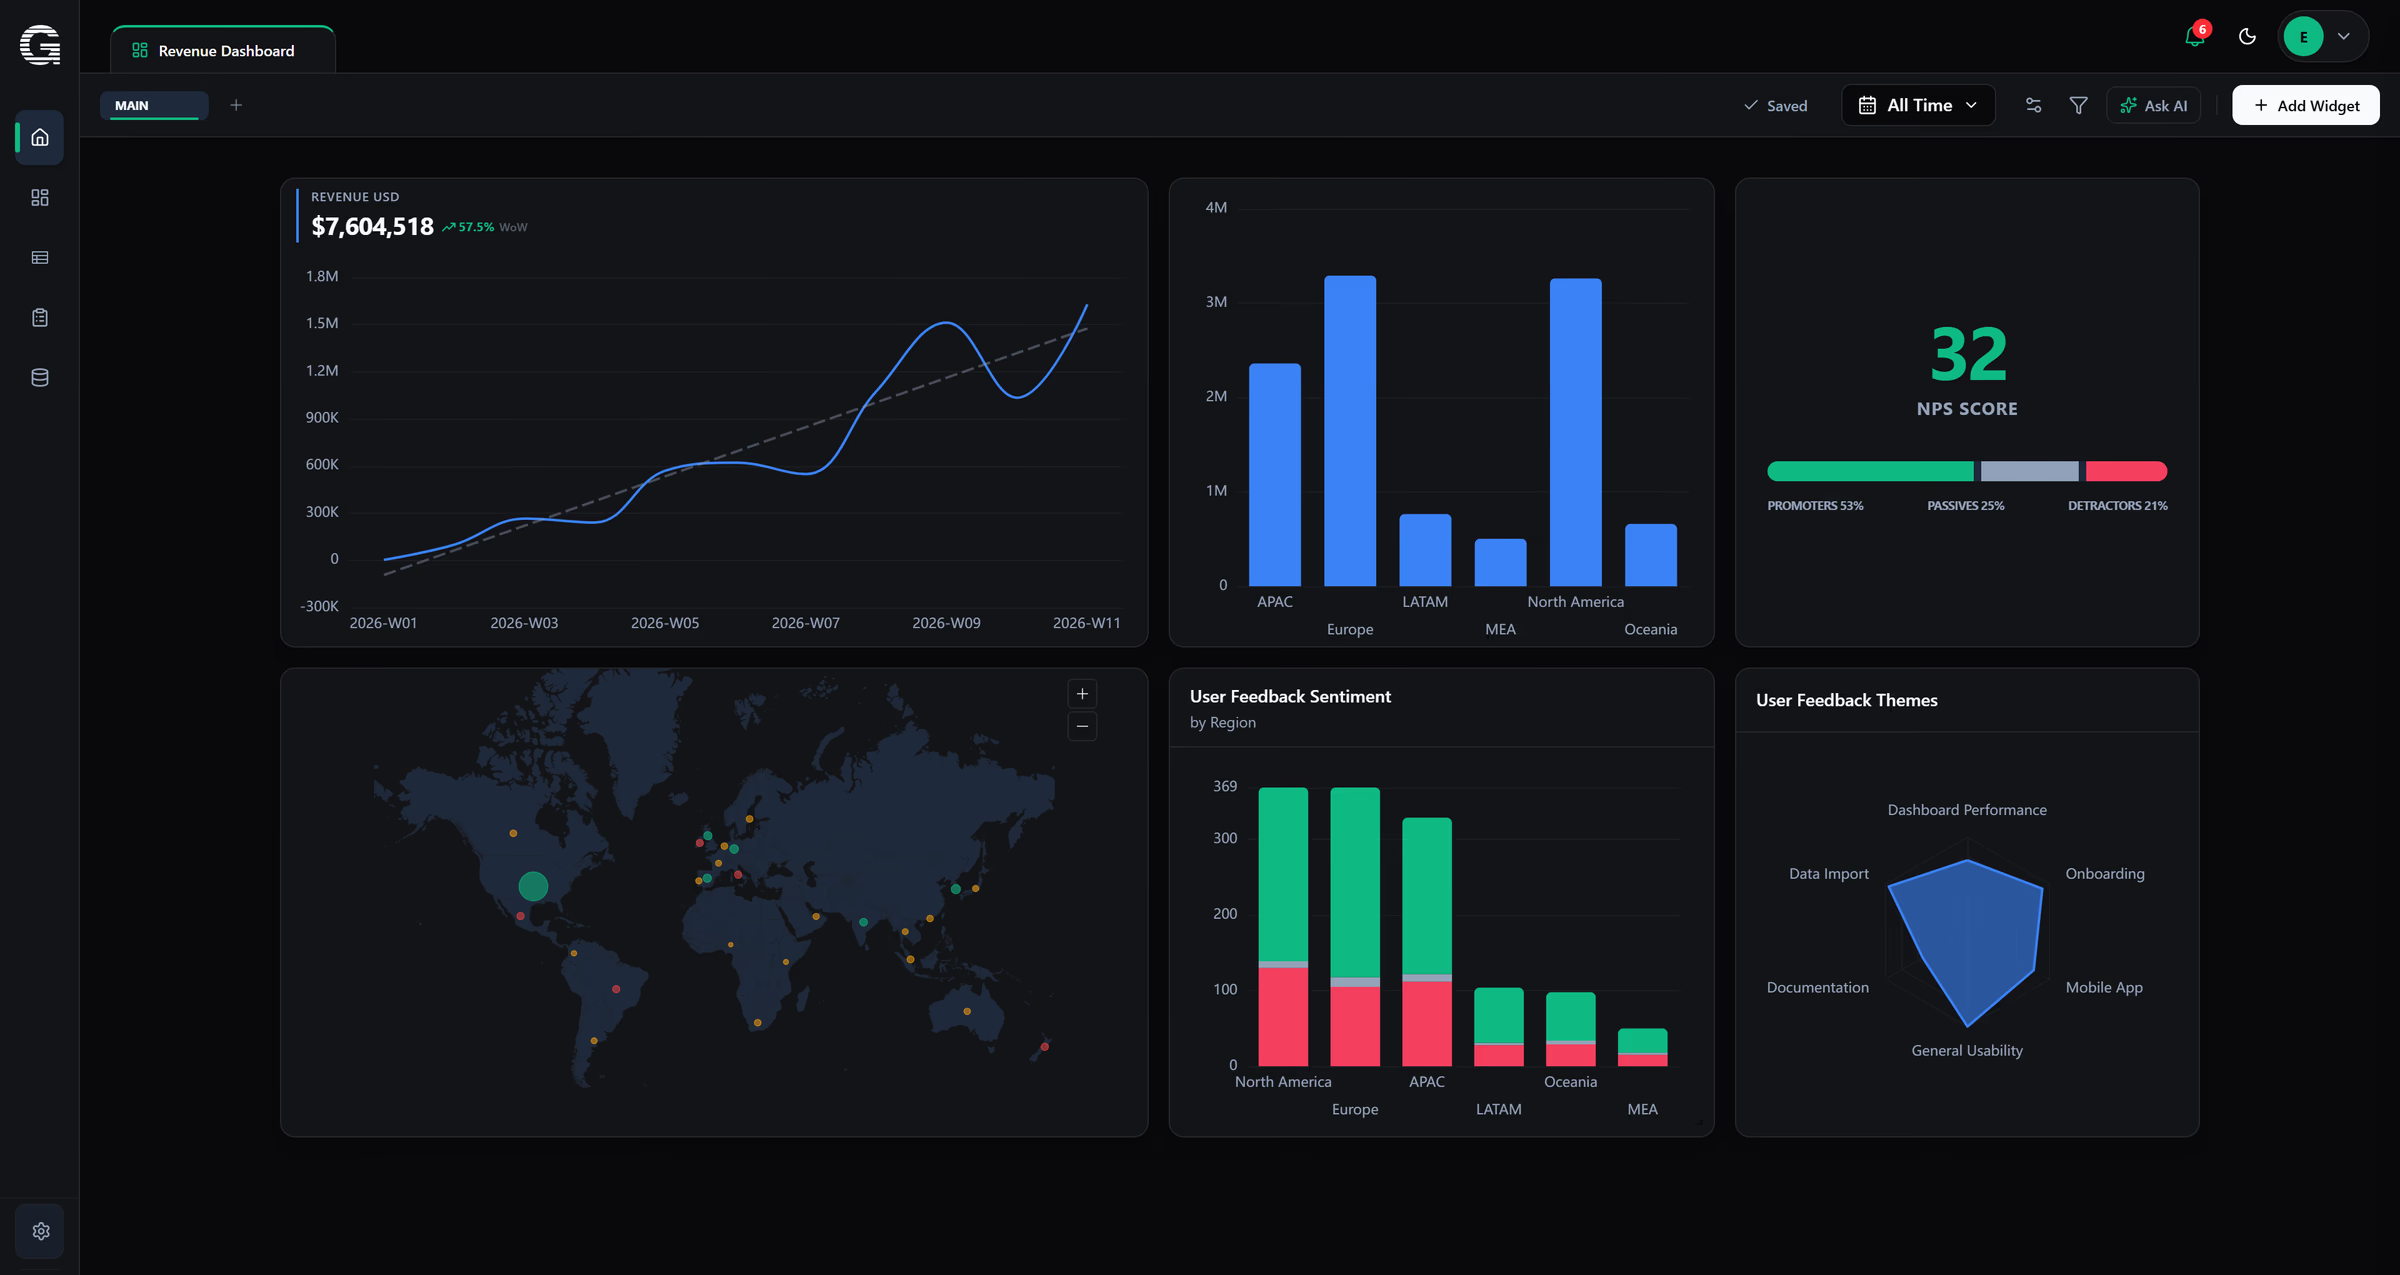
A real dashboard, built in Genuics.
Charts, filters, and KPIs in a single view. One tab, not ten.

The visualization tools your team won't outgrow.
Most analytics tools force you into the chart types they think you need. Genuics ships eighteen on day one, with full control over every label, axis, filter, and grouping. Reports can join multiple datasets automatically, so two NPS surveys become one overall score without writing SQL.
When you don't want to build by hand, ask. Type "show me revenue by location" and the AI Builder returns the report with chart, fields, and filters already set. Schedule it for Monday mornings. Share it with people who'll never log in.
What's included
- 18+ chart types
- AI report builder
- Joined datasets
- Scheduled delivery
- Drilldown to the row
- Export anywhere